17 Jul 2026
The Connection Between App Update Cycles and Retention Rates in Digital Wagering Platforms
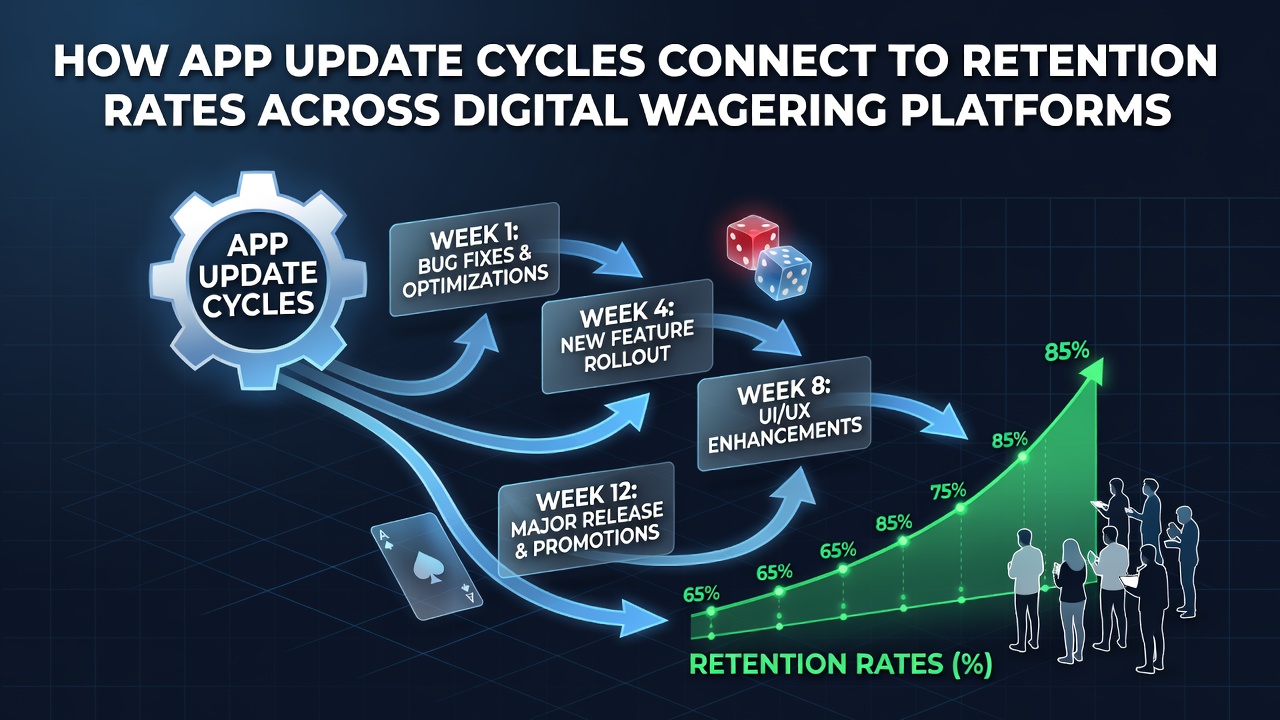
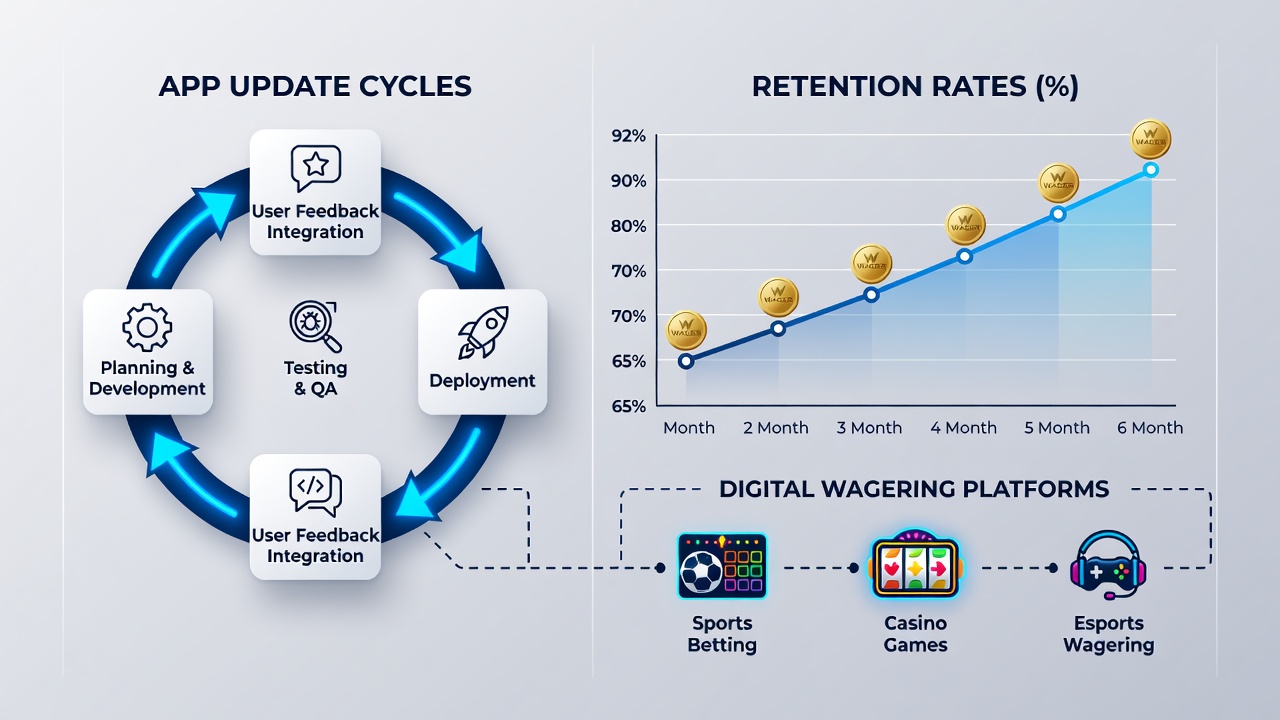
App update cycles in digital wagering platforms follow patterns that align closely with measurable shifts in user retention rates, and data from multiple markets illustrates these connections across different operating systems and regulatory environments. Developers release updates at intervals ranging from weekly security patches to quarterly feature overhauls, while retention figures track how many users return after the initial install or after specific engagement milestones.
Defining Update Cycles in Betting Applications
Update cycles typically divide into several categories that include minor patches addressing bugs, medium releases adding payment options or game variations, and major versions introducing redesigned interfaces or new compliance tools. Platforms operating under licenses from the New Jersey Division of Gaming Enforcement often schedule releases around monthly reporting deadlines, whereas operators in other regions adjust timelines based on local technical standards. Research indicates that shorter cycles averaging two to three weeks correlate with higher immediate download volumes, yet longer intervals between substantial changes sometimes stabilize daily active user counts over extended periods.
Retention Data Patterns Across Platforms
Retention metrics break down into day-one, day-seven, and day-thirty return rates, and figures collected from industry reports show distinct movements following update deployments. One analysis covering multiple European and North American operators found that platforms pushing updates more than once per month experienced an average 12 percent lift in day-seven retention when the changes focused on performance improvements rather than visual redesigns. In contrast, updates introducing new wagering categories without corresponding stability enhancements produced temporary dips that recovered within ten days in most observed cases.
Regional Variations in Update Frequency and User Behavior
Operators in Australia following the Interactive Gambling Act guidelines tend to space major updates further apart than their counterparts in Canadian provinces, where provincial regulators permit more rapid iteration. Data shows that Australian users maintain steadier thirty-day retention when updates arrive quarterly and emphasize responsible gaming features, while Canadian cohorts respond positively to bi-weekly patches that refine live betting interfaces. July 2026 saw several platforms in both regions align update schedules with seasonal sports calendars, resulting in coordinated release windows that minimized overlap with major event periods.
Studies conducted by academic teams at institutions tracking mobile engagement have documented how push notification strategies tied to updates affect re-engagement. When notifications announce new features within twenty-four hours of release, platforms record elevated session starts compared with delayed messaging, although the effect diminishes after the first week. Observers note that users who receive too many alerts following rapid update sequences sometimes reduce overall activity, creating a measurable trade-off between short-term spikes and longer-term consistency.
Technical Factors Linking Updates to Retention
Server-side compatibility, download size, and rollback mechanisms each play documented roles in how updates influence continued use. Platforms that keep update packages under 50 megabytes report fewer installation failures and stronger day-one retention, according to aggregated telemetry from multiple providers. Rollback options that restore previous versions within minutes of a problematic release have helped several operators recover retention curves that initially dropped after faulty deployments. Those who've examined cross-platform data find that Android users often show greater sensitivity to update size than iOS users, producing different retention trajectories depending on the dominant device base in each market.
Examples from Operator Reporting
Take one operator group that adjusted its cycle from monthly to bi-weekly releases focused on backend optimizations; internal metrics revealed a gradual climb in thirty-day retention across both poker and sports products. Another case involved a platform that introduced interface changes every six weeks alongside stability fixes, and subsequent reporting showed retention stabilizing at levels comparable to competitors with slower schedules. These examples illustrate how the content and timing of updates interact with existing user habits rather than operating in isolation.
Conclusion
Patterns emerging from retention tracking and update deployment records demonstrate consistent relationships between release frequency, update characteristics, and user return rates across digital wagering platforms. Operators continue to refine these cycles in response to regional regulatory requirements and technical performance data, while ongoing measurement provides clearer visibility into the outcomes of each adjustment.